Certification testing
Analyse the results
Inspect logs, identify failures and explore signals down to the bit level.
Sequence
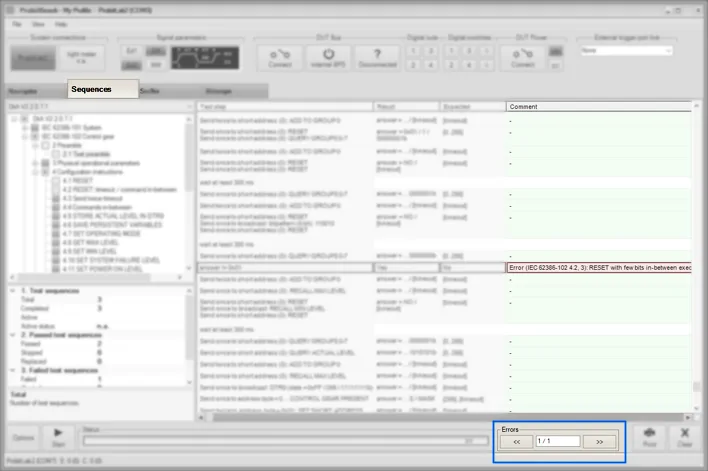
Use "<<" and ">>" to locate failed test steps.
Check the column "Comment" referring to the IEC/DiiA specifications.
Double-click on any row to align the Sniffer and the BitScope to the same point in time.
Sniffer
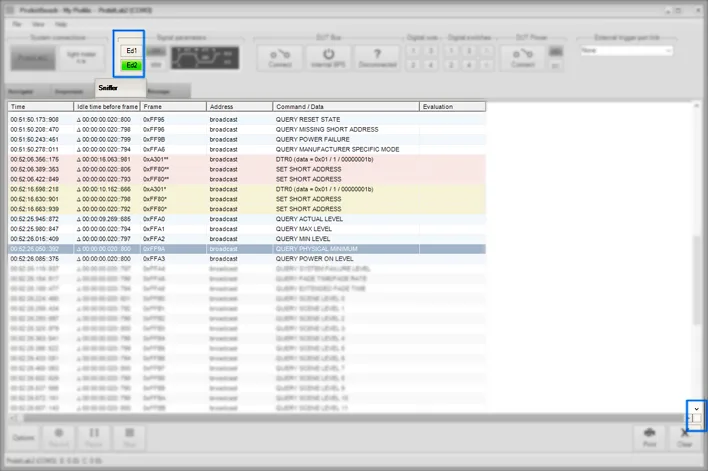
Yellow: the transmitter violated the timing specs but all receivers must receive this.
Red: the transmitter violated the timing specs and some receivers may not receive this.
Error: this bus signal cannot be interpreted at all.
An asterisk in the column "Idle time before frame" indicates a wrong inter-frame timing.
An asterisk in the column "Frame" indicates a wrong bit timing within this frame.
Use the Bitscope to investigate in more detail.
The analysis may follow the "Ed1" or "Ed2" timing specifications.
Tip: The Sniffer offers the same Time-Shift button as the Sequences.
Bitscope
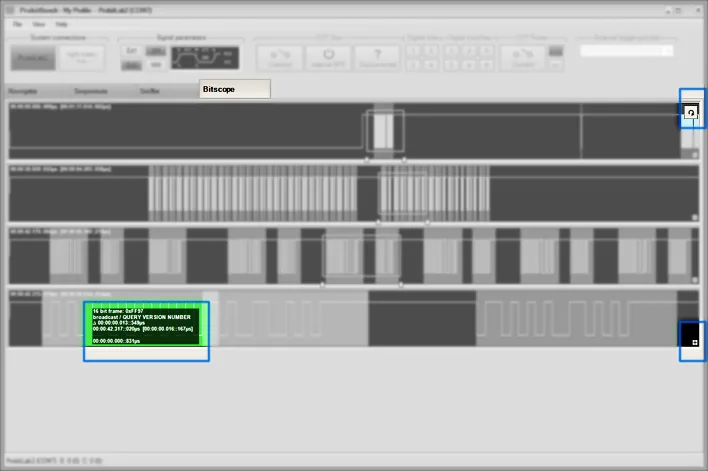
Use the reload button to update the BitScope to the most recent data.
Check the mouse-over for detailed information.
Use the mouse wheel to move left or right.
Use "Ctrl" + mouse wheel to zoom in or out.
Use "+" to add a new line.
Mark a section with the right mouse button held and it will be enlarged in the line below.
Green: the signal complies with all timing specs.
Yellow: timing specs violated but all receivers must receive this.
Red: timing specs violated, some receivers may not receive this.
Error: this bus signal cannot be interpreted at all (also marked red).
Check the mouse-over for more details on violations.
Double-click anywhere in the signal to align the Sequences and the Sniffer to the same point in time.
Navigator
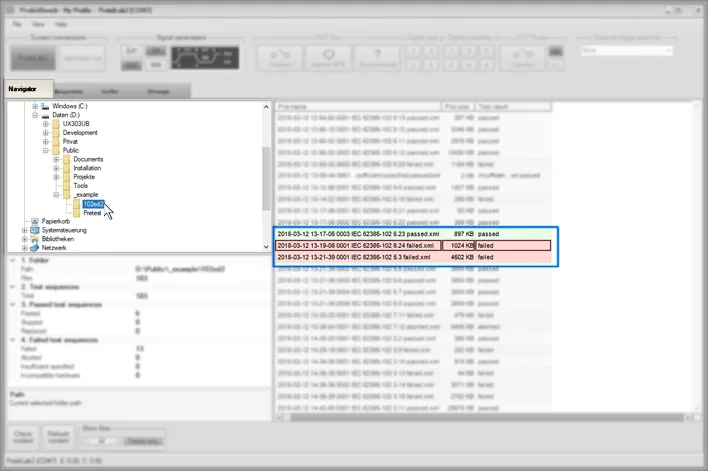
Browse through the tree view to select a folder with your XML protocol files.
Double-click on a file to load this data into ProbitBench.
Tip: Open another instance of ProbitBench to compare results of two tests.
Need help with this step?
Our DALI engineers are happy to help with any ProbitLab or ProbitBench question.